Here’s a newsflash which most startup marketers learn pretty quickly: nobody really cares that you just released feature set or design tweak #372 (unless you’re Facebook, in which case every tiny change you make will be over-analyzed with angry skepticism.)
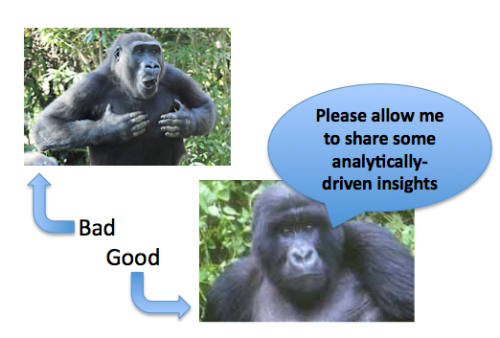
If you want to generate some continuous buzz about your startup and its message, eschew incessant feature news and chest-thumping. In their place, try what I’ll call the ‘data flank’ approach: find a way to use your company’s proprietary, anonymized data to create a steady drumbeat of interesting insights.
Getting buzz from data flanks isn’t just about gaining immediate site traffic, sign-ups, conversions, or even revenue. All those things are nice and tend to happen to various degrees, but the real benefits are often longer-term and longer lasting. Your site/brand begins to be perceived as an authority with credible data. Consumers/end-users are willing to trust you. Potential partners learn about you and become amenable to business development discussions.
I’ll give you 3 examples below (2 from my own experience) how this can be done, followed by some concrete suggestions for how to do it well.
1) A crowd favorite (and one of my gold standards for these types of data-driven insights) is online dating site okcupid, whose blog oktrends presses all the right buttons. It’s well-written, funny, based on rigorous data and analysis, and relevant to many of us.
This is a rather unique set of sexy data, because the data is for the most part about, well…sex. Still, reading okcupid’s excellent blog should give you ideas about how data can be presented in a way that’s entertaining, insightful, and at the same time reinforcing of the site’s core message (in this case, a big site used by interesting people who share honest feedback about their dating preferences).
OKCupid reports having 7 million active members and a whopping 1 million unique readers of its blog every month, an amazing statistic. The number of comments alone on each of its recent posts is testament to the power they have to engage readers, as you can see from some of these stats:
2) At my last startup, SiteAdvisor (later sold to McAfee), one of our marketing challenges was to take a relatively dry and obscure topic — web security — and try to broaden its appeal beyond just techy press and security forums. That meant trying to find a way to make web security fun, topical, relevant, and interesting to mainstream audiences with varied interests. We had lots of proprietary data about the safety of sites; we just needed to figure out how to make it interesting.
One of our early initiatives was to co-author an academically-rigorous report linking web security with a behavior that any internet user generally performs many times a day: search. Google “search engine safety“, and the report remains the #1 result even 5 years later. The study was featured in the Wall Street Journal, including a feature teaser above the fold on the front page of the print version. It helped us to both define, and own, the concept of “Safe Search”, which was the killer functionality of our software.
Having anchored our core message, we lightened things up a bit to broaden the audience. We began rating the safety of screensavers, grouped into topics that would resonate with different audiences.
We launched the World Cup of Spyware, pitting World Cup teams against each other in terms of which of their screensavers were more dangerous. That was picked up by sports writers. We did the same thing for MLB teams, American Idol finalists (pickup: celebrity/entertainment press), and a dozen other topics. A report called Mapping the Mal Web outlined dangers geographically, based on country-level domains.
Here’s an old press page showing some of our coverage in 2005 and 2006. Most of the links are now dead, but this still gives you a good sense of what we were able to accomplish. This page retains live links to some of the major studies.
The long-term results? A steady stream of broad-based press (which among other things helped to fuel the initial acquisition interest for the company), more than 100 million downloads of the SiteAdvisor app, and a subsequent major partnership with Yahoo.
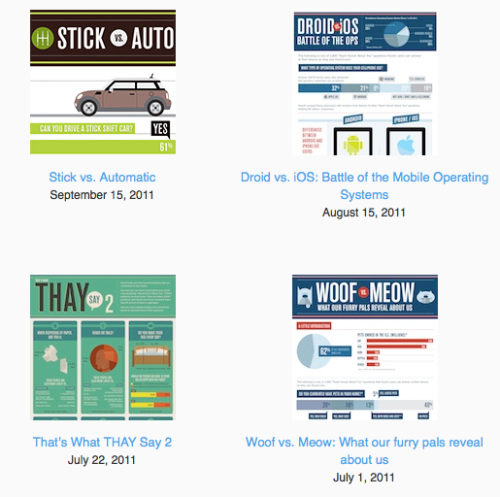
3) At Hunch, we took a page from the SiteAdvisor playbook and continued producing reports and data-driven blog posts about all kinds of topics based on the proprietary data from Hunch’s Taste Graph. More recently, we’ve had the reports turned into professional infographics (which seem to be all the rage these days) using a professional outside agency.
The combination of interesting topics, solid data, and professional design has been a hit. For example, our Mac vs PC infographic was picked up by dozens of top-tier press outlets worldwide, and was on the homepage of CNN.com for 5 days, generating hundreds of thousands of visits to our site. It also helped generate inbound business development inquiries. Retweets referencing our reports continue for months after their initial publication, and popular reports have hundreds of comments from passionate readers.
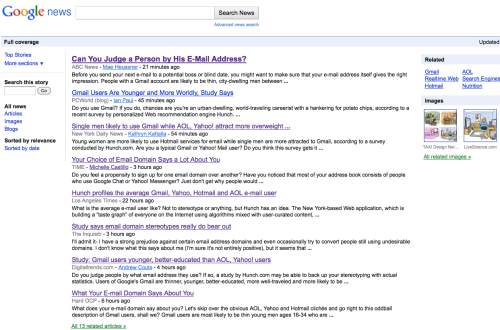
Another example of results: here’s some of the press coverage for our interactive report on what your email domain says about you (click to see a larger version):
Ready to get started on some data flanking to market your startup? Here are a few practical tips to keep in mind:
1) Make an initial time investment to build some internal query tools so that your marketing or analytics team can explore data without involving the development team every time in one-off queries. Another approach is to make sure you have some of your marketers trained in basic data mining techniques, such as the ability to run straightforward sql queries on your database. (caveat: make sure there’s nothing they can do to crash your database; working on non-live data is probably safest)
2) Establish an editorial calendar for data-driven reports and insights and keep the ideas flowing with a steady drumbeat. (Cue the sports analogies like multiple shots at goal or times at bat.) Strive for a mix of evergreen topics and more topical themes that are pegged to news and major events.
Your best reports may very well go viral, but be careful about trying to predict which ones will. Instead, be ready for the winners when they emerge, so you can add fuel to the fire through levers you can directly control like promoted Tweets, Stumble Upon paid discovery, or BuzzFeed promotion.
3) Dial back the self-serving branding on most of your pieces and allow the data to take the spotlight. Think soft-sell. Notice how most of Hunch’s infographics have just small copy about Hunch and a small logo on the bottom right.
There’s an inverse correlation between the likelihood that media/press is going to pick something up and the square inches you take up with your branding and hard-sell messaging. Don’t worry, your attribution will come via links back to you, social media recognition, comments to your posts, and long-term business development benefits.
4) There’s an opposite corollary to #3. Rather than water down the effectiveness of all your reports/insights with drippy branding, choose just a few “internally-focused” pieces and go all out with your self-promotion. These should be the rare instances of chest-thumping at its finest.
Here’s how Foursquare did it to celebrate their impressive end-of-year 2010 metrics. At Hunch, we created a message-defining infographic explaining what goes into our Taste Graph. We didn’t expect it to receive tons of press (although it did get some), but rather it serves as a great “anchor the message” explanation for what we do, and we link to it all the time.
5) Pitch one outlet at a time. I don’t believe in spamming bulk lists of reporters or publications with every announcement or report we generate. We come up with custom lists every time, and generally write a personalized email to each person. This has helped us to build first name relationships with many great publications, bloggers, and reporters. Be especially careful if you use an outside agency that they don’t blast a pitch in a way that turns people off and is considered spam.
6) Packaging matters. Invest in great design to illustrate your data either through in-house talent or a qualified outside agency. You can get additional inspiration on sites like visual.ly, good.is, Many Eyes, and any number of infographic collection sites.
The examples above are primarily based on static, non-interactive data features. In a later post I’ll discuss some nice examples of interactive features that accomplish the same goals.


Thanks for this. Really good thoughts.
Column five is super expensive. They said something crazy like $150/hr. Do you know any cheaper infographic design firms?
Your point about pitching one outlet at a time is one of the most important. I’ve always had far more success at getting press attention when I take the time to research the publication/journalist.
It stands to reason if you know who you’re talking to you, you’ll have a much better idea of what pushes their buttons. And you’re showing that you care about whether or not they feature you. It’s not guaranteed to work, but you’ll likely do better than with a scattergun approach.
Pingback: Marketing your startup with a steady drumbeat of data | Tech Start Hub
Pingback: Mozilla Hacks Weekly, September 29th 2011 ✩ Mozilla Hacks – the Web developer blog
Interesting post. Just realising how well people respond to hearing statistics and why it makes things sound so much more newsworthy and interesting to the media.
Enjoyed it.
These are great suggestions. The key message is something most online businesses seem to overlook; distributing interesting, useful information is more valuable for everyone than pure self promotion.
Pingback: Google+, Social Web, SEO And Guy Kawasaki – Speedlink 37
Giving away the raw data is a good concept as well: http://www.odditysoftware.com/blog/free-dunkin-donuts-database-and-developer-resources_47.html
Pingback: Speedlink V37/2011, Google+, Social Web, SEO And Guy Kawasaki | Makegrn 2.0
Kelly, thank you for opening my mind to marketing through data-driven insights. It works so well! After I went to “professionally & critically” evaluate your examples, I was toast. 🙂 It got my attention for hours.
Pingback: Quora
Pingback: Vortrag: Einfluss von Social Media auf SEO - sfrisch.de
I like what you guys tend to be up too. This type of clever work and coverage!
Keep up the excellent works guys I’ve incorporated you guys to my personal blogroll.
Kelly, fantastic post! So much great information in one place.